Soloros Group Project
The Report
A copy of the report can be found here
The Simulation
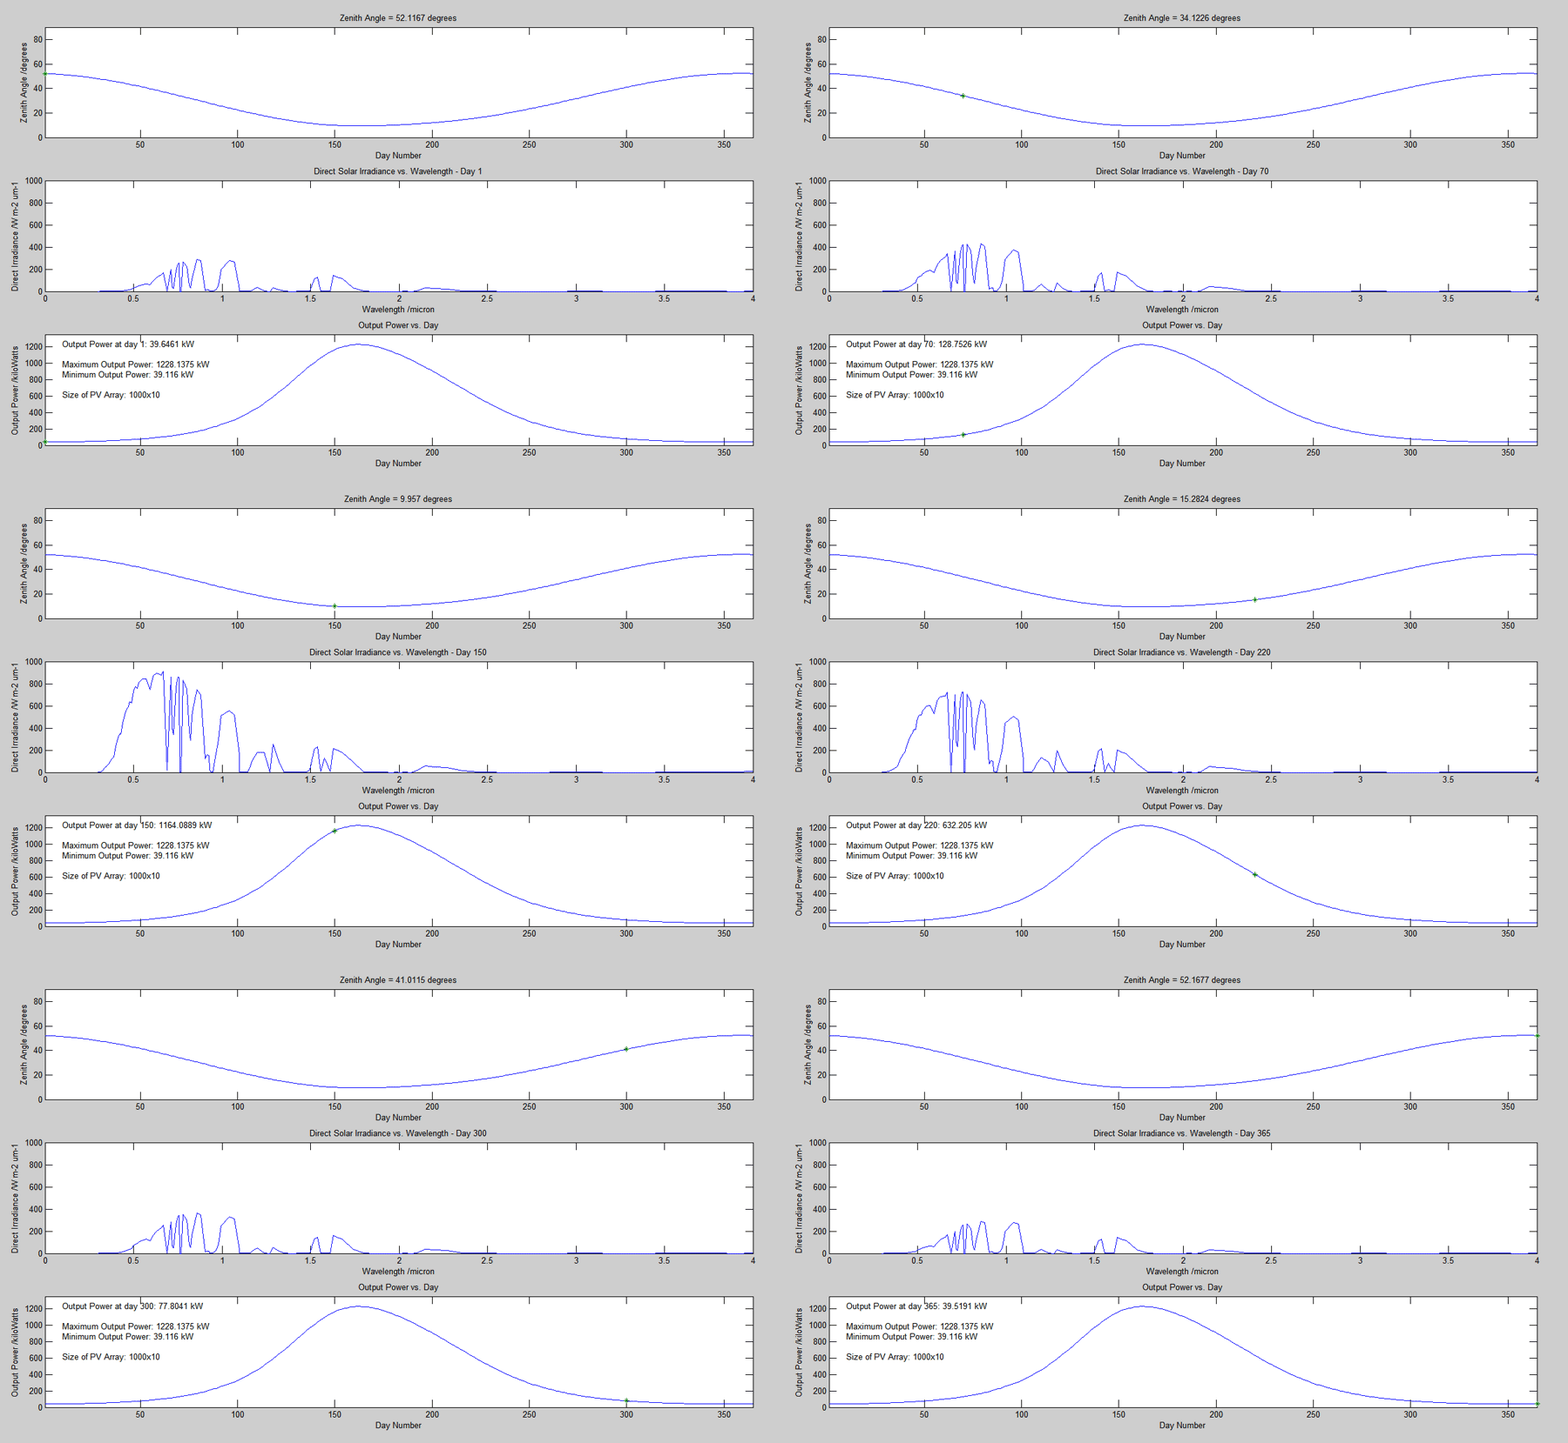
- The top graph shows the change in the zenith angle of the sun at our chosen mountain site in Nepal over the course of a year.
- The middle graph shows the direct solar irradiance received by our solar power plant with respect to wavelength.
- The bottom graph shows our generated power output after taking into the account the PV array size.
Transmission Modelling

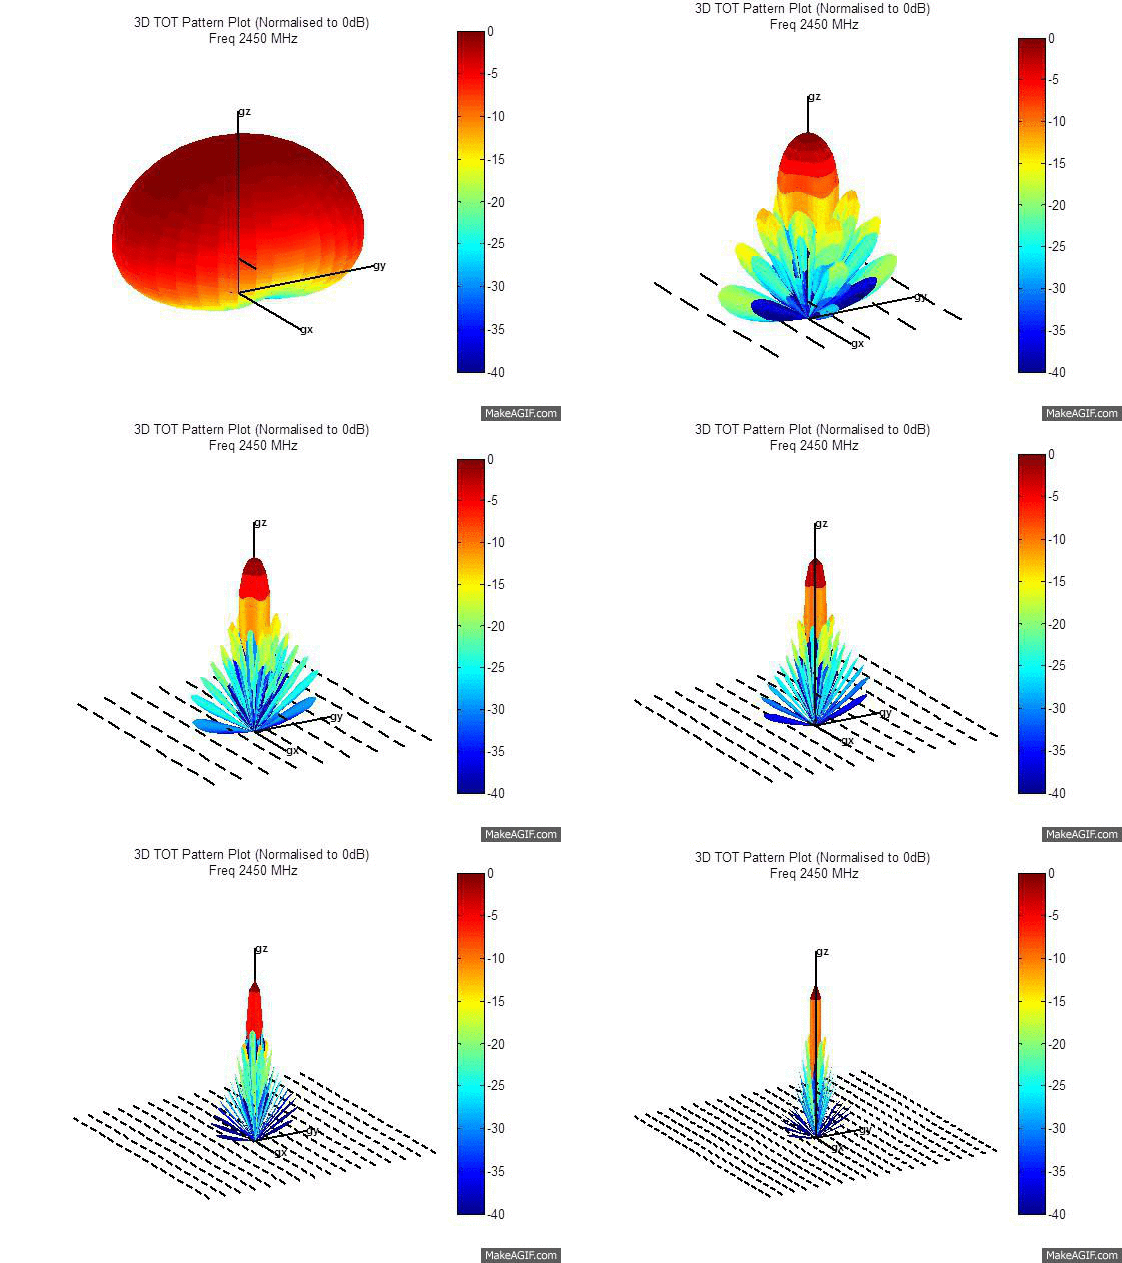
Simulation of a rectangular dipole array of varying sizes from 1x1 to 20x20
In order to achieve a transmission efficiency greater than or equal to 70%, we need a product directivity of 5.02 x 10^12. This product directivity is formed from the directivity of the transmitter multiplied by the directivity of the receiver. If we split these directivities evenly, each on should be 2.24 x 10^6.
In order to increase directivity, we must first increase array size

.png)


