


HOMER Setup
HOMER is a software tool we used to simulate our microgrid solution for providing electricity to a village in rural Bihar, India. HOMERs strength lies in its ability to quickly compute different combinations of equipment for generating electricity. The software ranks different combinations of various sizes of various energy sources by cost effectiveness. In this case, we had 24000 possibilities, and the winner, purely in terms of cost, was a system with a 100kW micro-hydro, 200kW biogas and 25kW diesel generators. In addition, we compared these standalone systems with the traditional option of grid-extension.
While the high capital costs of some of the alternative sources of energy can prove to be quite a disincentive, we must remember that grid extension to rural areas in developing countries can be very expensive. A study by the World Bank estimated the capital cost of grid extension to be 8000-10000$/km, without taking into account cost of materials, which adds another 7000$/km [i]. Hence, high costs in addition to the low and dispersed demand of rural population discourage utilities to provide connection to these people.
Below is a screenshot of the different renewable sources of energy we wanted to simulate for our region in Bihar. (Click to Enlarge)

- Equipment consists of wind turbines, a diesel generator, a biogas generator, photovoltaic panels, a battery and a converter.
- The primary load has been modeled for an average village size in Bihar of 2000 people or 333 households, with 6 members each [ii]. Each household is assumed to have a peak consumption of 675W, with a load factor of 0.2 [iii].
- Our resources are diesel, biomass, solar radiation, and wind.
- The cost of diesel is taken to be 40Rs/L = 0.9$/L.
- The fuel for the biogas is assumed to be rice husk, which Bihar produces 1.8 billion kilograms of every year [iv]. The price of the biomass is approximately 1Rs/kg.
- We look at the micro-hydro turbines at half their full capacity, and in the best possible case at 75% of their design flow rate.
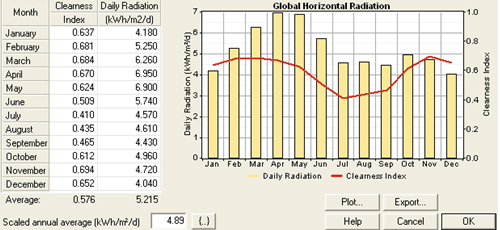
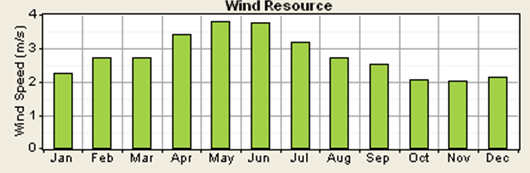
- The tables below show the average wind speeds solar radiation in Bihar, obtained from NASA [v].
Solar Radiation
Wind Speed
>>>Continue reading: Simulation Results & Conclusion
References
[i] Aeck, Cristopher Flavin and Molley Hill. Energy Development: The Potential Role of
Renewable Energy in Meeting the Millennium Development Goals. Paris: Renewable
Energy Policy Network for the 21 Century, 2005.
[ii] 2001 Census
[iii] Kamalapur G D, Udaykumar R Y. Electrification in rural areas of India and consideration of SHS.
2010 5th International Conference on Industrial and Information Systems, Jul 29 - Aug 01, 2010, India.
[iv] Greenpeace India Society. Empowering Bihar. October 2010. greanpeaceindia.org.
[v] NASA.