The WSNDemo application is intended to organize a wireless sensor network (WSN) composed of Atmel MeshBean boards. Each WSN node periodically reads the data of its on-board sensors (light, temperature and battery power) and sends them to coordinator, which in turn sends the data to the PC's COM port. A special GUI application named WSN Monitor running on the PC displays the network topology and sensor data in an easy-to-interpret graphical form.
To start the WSNDemo, do the following:
| DIP switches | Role | ||
| 1 | 2 | 3 | |
| ON | OFF | OFF | Coordinator |
| OFF | ON | OFF | Router |
| OFF | OFF | ON | End device |
Coordinator organizes the wireless network automatically. The WSN activity may be observed in two ways, i.e. by on-board LEDs (see description in the table below) and via the WSN Monitor running on PC.
| Node State | LED state | ||
| LED1 (Red) | LED2 (Yellow) | LED3 (Green) | |
| Standby | blinking synchronously | ||
| Searching for network | blinking | OFF | OFF |
| Joined to network | ON | ||
| + receiving data | blinking | ||
| + sending data | blinking | ||
| Sleeping (end device only) | OFF | OFF | OFF |
The source codes of WSNDemo application are located at
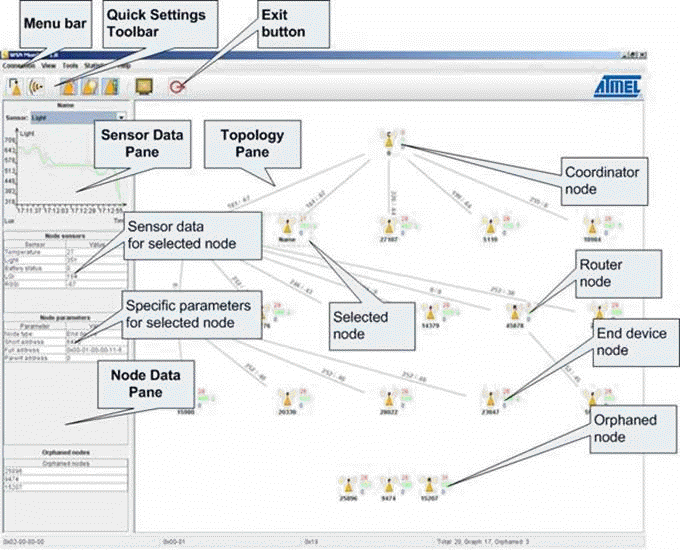
WSN Monitor is a PC-based GUI diagnostic application for WSNDemo
that is used to display the network topology and other information about the network.
Run WSNMonitorSetup.exe located at
Take a look at the screenshot below. WSN Monitor displays the network tree in real time and updates it automatically as the nodes join or leave. The nodes are represented by icons with the node data tips. The links between the nodes are tipped with the link quality data. Sensor data for each node is recorded and may be visualized in graphs and in table at any time.
On startup, go to Tools, Settings, and select the proper communication port from the COM port list. Also, check that the Parse sensors as value is set to int-32, in order to read the sensors measurements correctly.
Use top-level program menu and toolbars to control the topology outlook.

 1.5.1-p1